Boundary [2026.04.02]
Marine boundary data such as exclusive economic zones (EEZ) and large marine ecosystems (LME), plus coastlines and area-calculation tools.
Boundary datasets
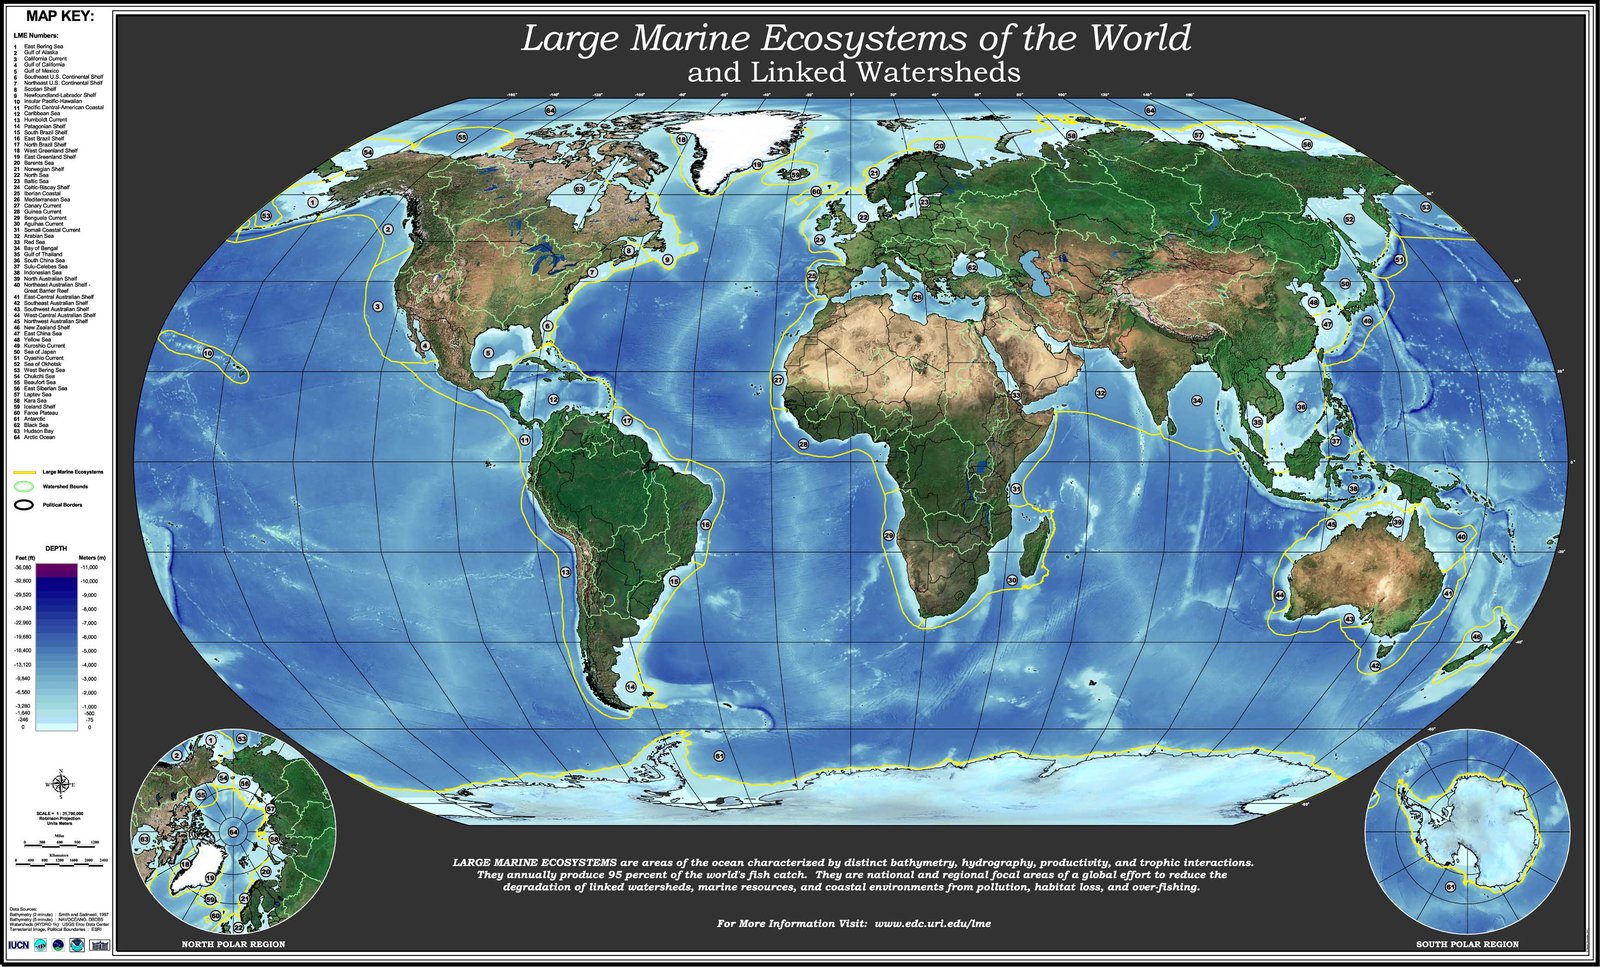
-
Marine Regions
Shapefiles of EEZ, LME, and other marine boundaries
-
Large Marine Ecosystems (LME)
LME layers and maps on IW:LEARN GeoNode
Global Large Marine Ecosystems
LME-66 Offshore
Large Marine Ecosystems (map) -
Oceans of the World
Ocean division polygons (IW:LEARN GeoNode)
Oceans of the World
World Oceans and Large Marine Ecosystems (map) -
NOAA LME map
LME map from the NOAA 200th anniversary pages
Coastline & tools
-
Global Coastline
Coastline data (GSHHS and others)
Shoreline / Coastline Resources (NOAA NCEI)
GSHHS (NOAA NGDC) -
Area on sphere / ellipsoid
Polygon area on spherical or ellipsoidal coordinates (MATLAB Mapping Toolbox)
EEZ in MATLAB
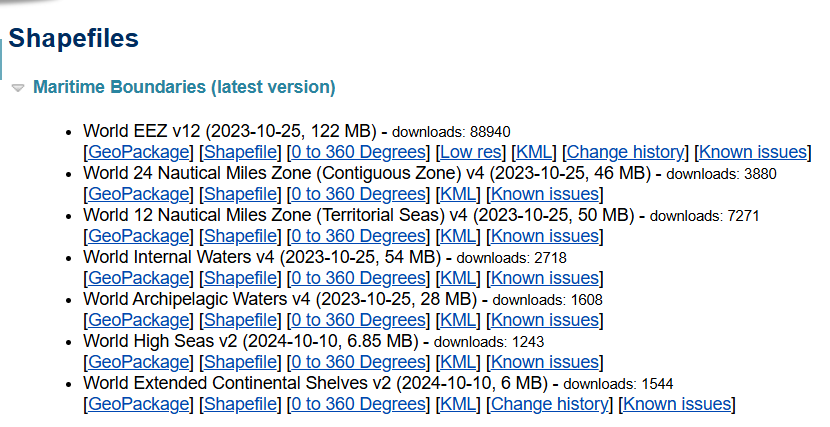
Download the EEZ Low res file from Marine Regions and put the .dbf, .shp, and .shx files in one folder.
shaperead requires the Mapping Toolbox add-on.
Clip EEZ polygons to a region and draw them with m_map
S = shaperead('D:\eez_v12_lowres.shp'); % mapping toolbox 에드온 설치 필요

lat_min = mla(1);
lat_max = mla(2);
lon_min = mlo(1);
lon_max = mlo(2);

keep = false(1, numel(S));
for k = 1:numel(S)
    X = S(k).X;
    Y = S(k).Y;
    mask_valid = ~isnan(X) & ~isnan(Y);
    % 지정된 범위에 일부라도 걸치는 폴리곤만 선택
    keep(k) = any(X(mask_valid) >= lon_min & X(mask_valid) <= lon_max & ...
                  Y(mask_valid) >= lat_min & Y(mask_valid) <= lat_max);
end
S_clip = S(keep);


% m map 켠 후

    for k = 1:numel(S_clip)
        xCoord = S_clip(k).X;
        yCoord = S_clip(k).Y;

        % NaN으로 끊어진 세그먼트 경계 찾기 (선 하나하나 그리기 위해)
        nanPos = find(isnan(xCoord) | isnan(yCoord));
        edges  = [0, nanPos, numel(xCoord)+1];

        for s = 1:numel(edges)-1;
            i1 = edges(s)+1;
            i2 = edges(s+1)-1;
            if i2 < i1, continue; end

            xs = xCoord(i1:i2);
            ys = yCoord(i1:i2);


            % 지도 범위 밖 세그먼트 건너뛰기
            if all(xs < lon_min | xs > lon_max | ys < lat_min | ys > lat_max)
                continue
            end

            % reducem은 열벡터 기대 → 열로 변환
            xs = xs(:);
            ys = ys(:);

            mask = true(size(xs));   % 기본: 모두 사용

            % 여기에 필터링을 추가하면 원하는 선만 그릴 수 있음
            d = diff([false; mask; false]);
            iStart = find(d == 1);
            iEnd   = find(d == -1) - 1;

            for jj = 1:numel(iStart)
                segx = xs(iStart(jj):iEnd(jj));
                segy = ys(iStart(jj):iEnd(jj));
                if numel(segx) < 2, continue; end

                % 단순화 후 그리기
                [segyR, segxR] = reducem(segy, segx, 0.05);
                if numel(segxR) < 2, continue; end

                m_line(segxR, segyR, 'color',[0 0.6 0], 'linestyle','--', 'linewidth',1.2);
            end

        end
    end