Atlas & Climatology [2026.05.12]
Global and regional ocean climatologies (atlases) and gridded observation-based products.
What is a climatology?
According to the World Meteorological Organization, the term "climatology" defines long-term averages of a given variable, like sea surface temperature, over various time periods, usually 30 years. In oceanography, the term "ocean climate" is used to define ocean parameters averaged over a decade or longer. Ocean climatologies, global or regional, relate specifically to long-term averaged oceanic parameters (temperature or salinity, for example) in the entire world ocean or in selected ocean regions. Source: NCEI
Global atlas & climatology
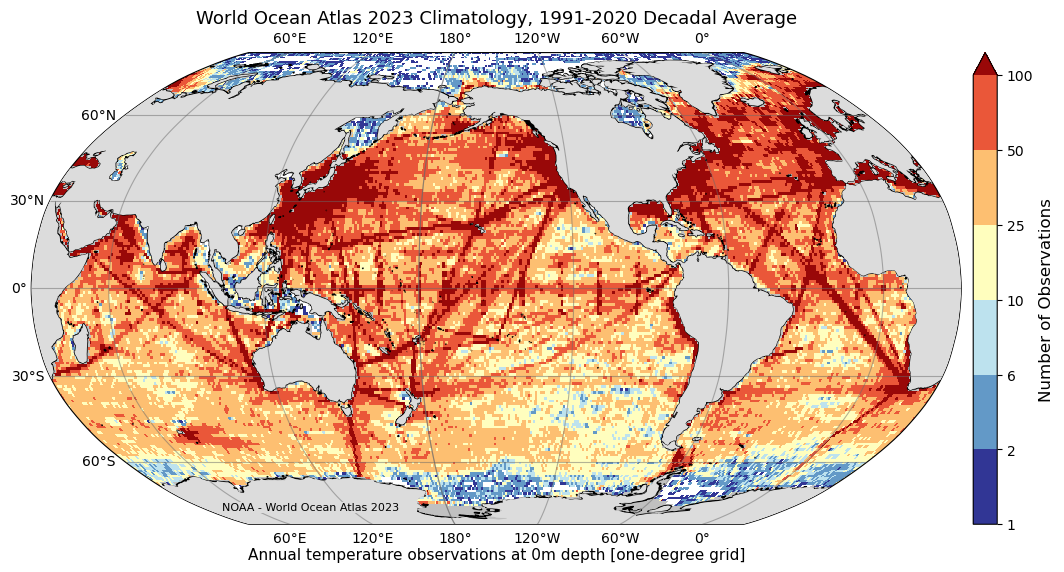
World Ocean Atlas (WOA23)
1° and 1/4°, 102 levels
Objectively analyzed T, S, oxygen, and nutrient (phosphate, silicate, nitrate) means from WOD profiles
World Ocean Atlas
WOA23 data access (temperature)
Multi-platform archives (In Situ)
How to download WOD
About WOA23
The World Ocean Atlas (WOA) is a collection of objectively analyzed, quality controlled temperature, salinity, oxygen, phosphate, silicate, and nitrate means based on profile data from the World Ocean Database (WOD). It can be used to create boundary and/or initial conditions for ocean models, verify numerical simulations, and corroborate satellite data.
The full WOA23 was released on February 14, 2024 and includes temperature, salinity, oxygen (plus Apparent Oxygen Utilization and percent oxygen saturation) and inorganic nutrients (phosphate, silicate, and nitrate). It adds approximately 1.8 million new casts since WOA18, with renewed quality control. Data are given at 102 standard depth levels.
- Temperature, salinity: one-degree and quarter-degree grids, for 1955–1964, 1965–1974, 1975–1984, 1985–1994, 1995–2004, 2005–2014, 2015–2022, and three 30-year climate normals (1971–2000, 1981–2010, 1991–2020).
- Nutrients: one-degree, 1965–2022.
- Oxygen, AOU, percent saturation: one-degree, 1965–2022 and 1971–2000.
- All-data five-degree statistics for each variable.
WOCE Hydrographic Program Atlas
1990s
Sections, horizontal maps, and property-property plots from the WOCE One-time survey (four basin volumes)
WOCE Atlas Home
Research Vessel Surface Meteorology Data Center
About the WOCE Hydrographic Program
The Hydrographic Program of the international World Ocean Circulation Experiment (WOCE) was a comprehensive global hydrographic survey of physical and chemical properties, of unprecedented scope and quality, and represents the "state of the oceans" during the 1990s. Each of the 4 basin-oriented volumes includes vertical sections of the measured parameters for each One-time survey cruise, horizontal maps at standard depths and along isoneutral surfaces, and property-property plots for each section.
CMEMS ISAS
0.5°, monthly
In Situ Analysis System. 2023.01.01 – 2025.12.01
INSITU_GLO_PHY_TS_OA_NRT_013_002
ISAS T, S, DO gridded fields (SEANOE)
CMEMS ARMOR3D L4
In situ based gridded product. The current component is reported to be computed from the thermal wind equation
SeaDataNet Climatologies
IAPv4
Ocean temperature & OHC gridded
Cheng et al. (2024)
ESSD paper
Temperature (doi:10.12157/IOCAS.20240117.002)
OHC (doi:10.12157/IOCAS.20240117.001)
WOCE Atlas by basin
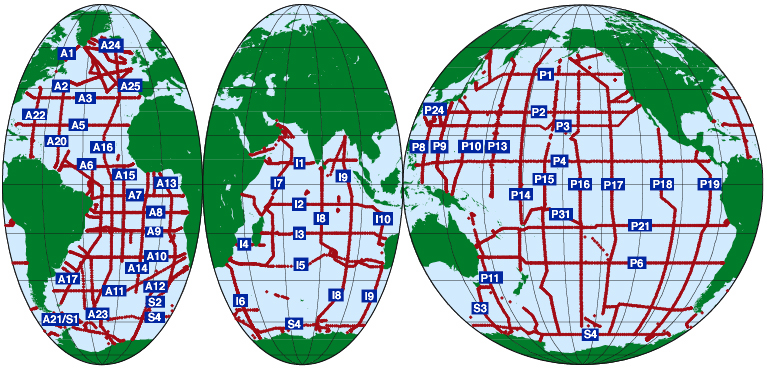
- Section data: Southern Ocean: Lines
- Mapped data: Southern Ocean: Maps
WOCE Atlas Volume 2: Pacific Ocean
- Section data: Pacific sections → "CCHDO (WHPO) Data Link"

WOCE Atlas Volume 3: Atlantic Ocean
- Section data: Atlantic sections → "CCHDO (WHPO) Data Link"
WOCE Atlas Volume 4: Indian Ocean
- Section data: Indian sections → "CCHDO (WHPO) Data Link"
Climatological gridded Argo products
WOA (incorporating Argo)
See the WOA and the global atlas section above
MIMOC
1/2°, 81 levels to 1950 dbar
NOAA-PMEL / University of East Anglia. Argo plus others, climatological year, emphasizing data since 2007
RG Climatology
1°, 58 levels to 2000 dbar
Scripps. Argo only, optimal interpolation. 2004–2018 is distributed as a climatology; from 2019 onward, monthly fields are provided
Roemmich-Gilson Argo Climatology
Reference (Prog. Oceanogr.)
Regional atlas
NCEI Regional Ocean Climatologies
1/10° or finer
High-resolution regional climatologies from the WOD (annual, seasonal, monthly means)
About the NCEI Regional Ocean Climatologies
NCEI regional ocean climatologies are ocean climate analyses derived from the World Ocean Database (WOD) for climatologically, economically, and ecologically important regions. They are high-resolution, quality-controlled, multidecadal climatologies with annual, seasonal, and monthly means for temperature, salinity, and other WOD variables.
They are built by objective analysis of irregularly distributed data, which works only where data coverage supports a 1/10° or finer grid, so that mesoscale features (jet meanders, eddies, vortices, filaments) can be mapped accurately. Seidov et al. (2018, 2019) describe the method using the Northwest Atlantic as a case study.
Ocean climate normals around the Korean Peninsula
KODC (NIFS) ocean climate normals and a DIVA-based continuous gridded time series
KODC Atlas
Continuous gridded T/S time series around Korea (DIVA, v1)
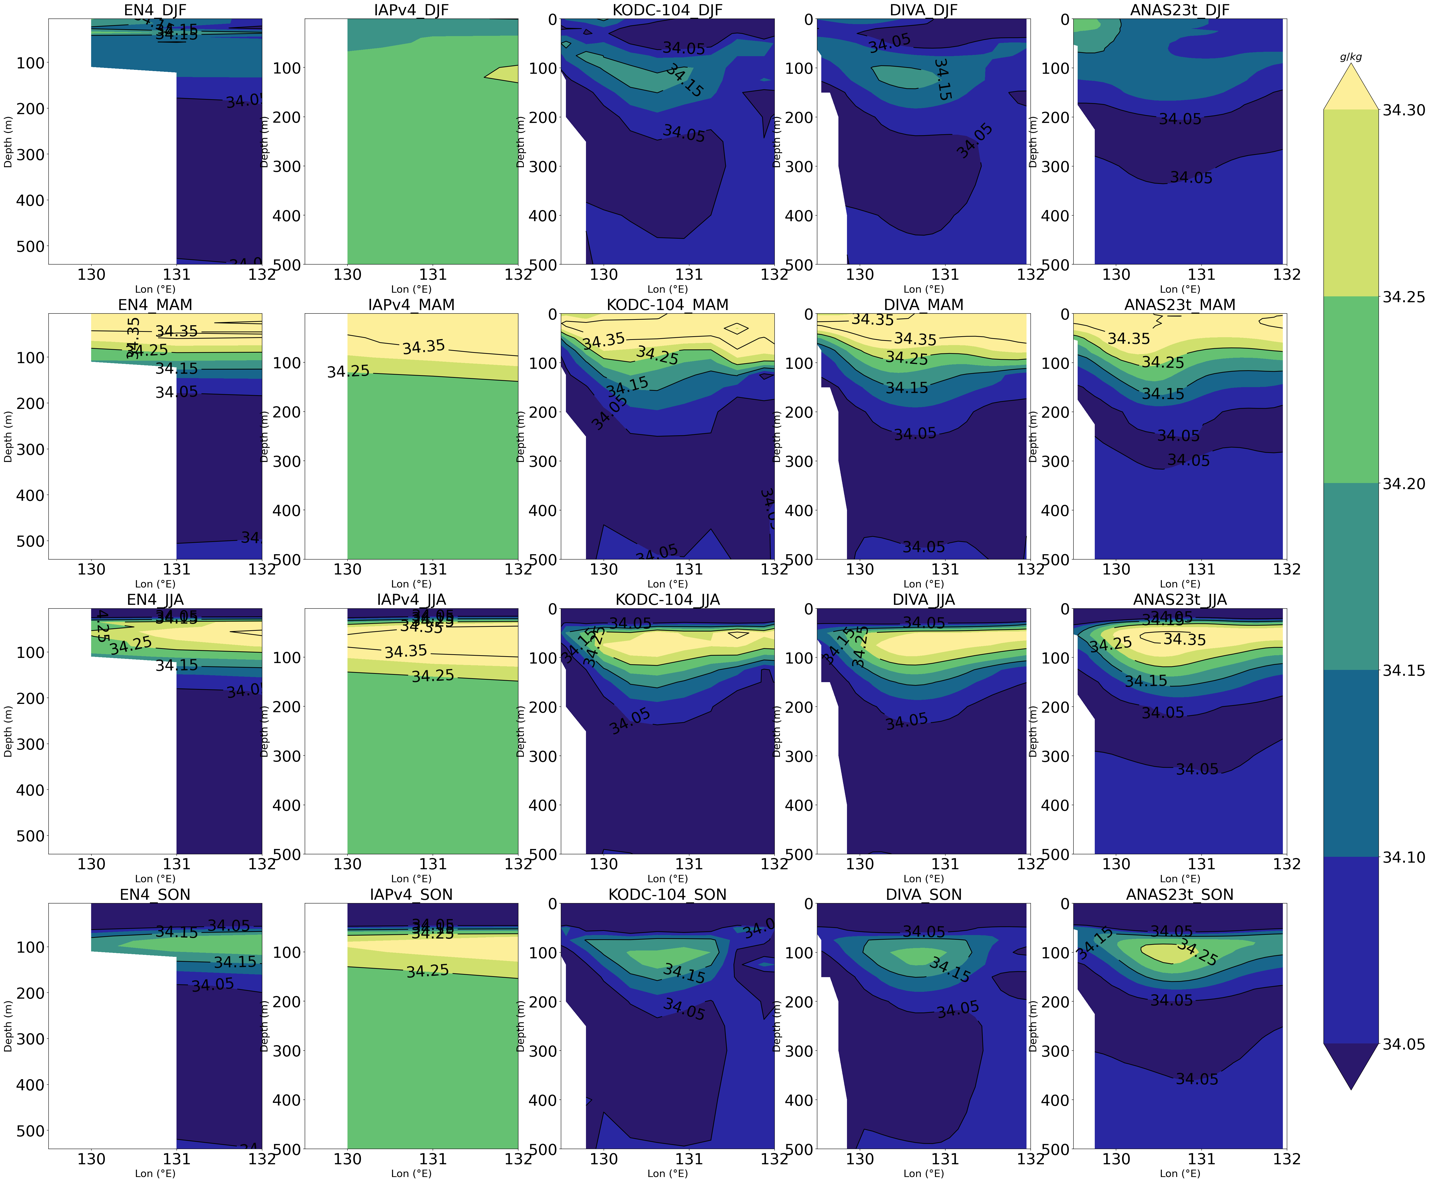
ANAS23
1/10°, 73 levels, monthly
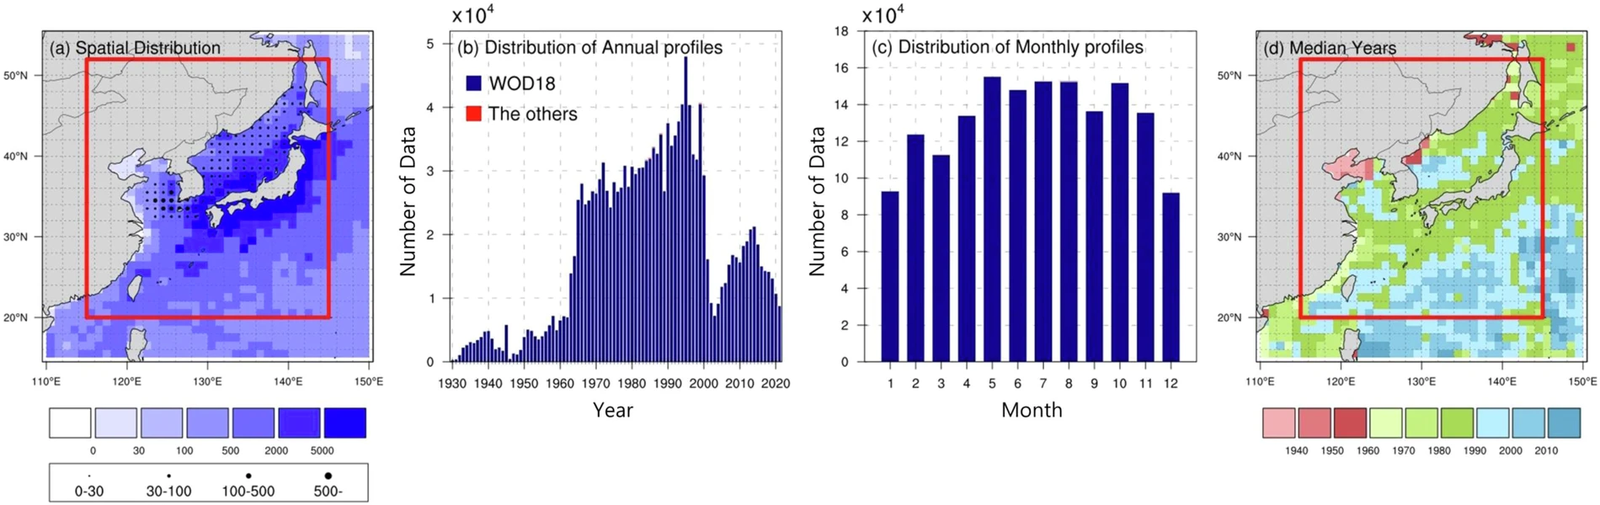
Monthly temperature and salinity climatology for the Northeast Asian Seas (20–52°N, 115–145°E), KIOST
Scientific Data paper
KIOST repository
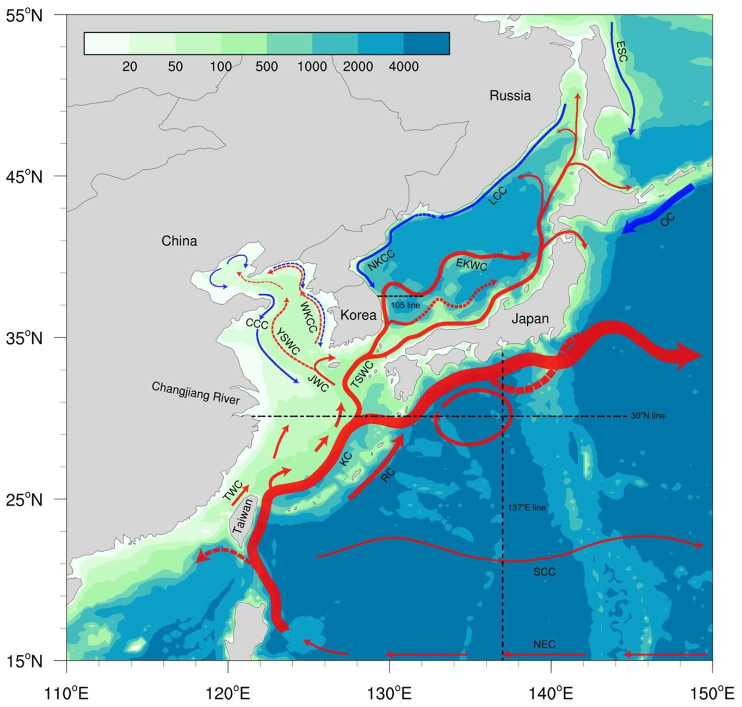
ANAS23 details
The ANAS23t contains monthly climatological temperature and salinity and their error variance for the Northeast Asian Seas (20–52°N, 115–145°E) with 1/10° horizontal resolution and 73 vertical levels. Over 1.6 million hydrographic profiles were analyzed, and interpolation was done by kriging.
| Item | Value |
|---|---|
| Domain | 20–52°N (320 grids), 115–145°E (300 grids) |
| Horizontal resolution | 1/10° |
| Depth levels (73) | 0–100 m every 5 m, 125–500 m every 25 m, 550–1,500 m every 50 m, 1,500–5,500 m every 250 m |
| Temporal interval | Monthly climatology for 0–1,500 m, annual climatology below 1,500 m |
| Variables | tmp (temperature), sal (salinity), tmp_errvar, sal_errvar (error variances) |
East/Japan Sea 3-D temperature reconstruction
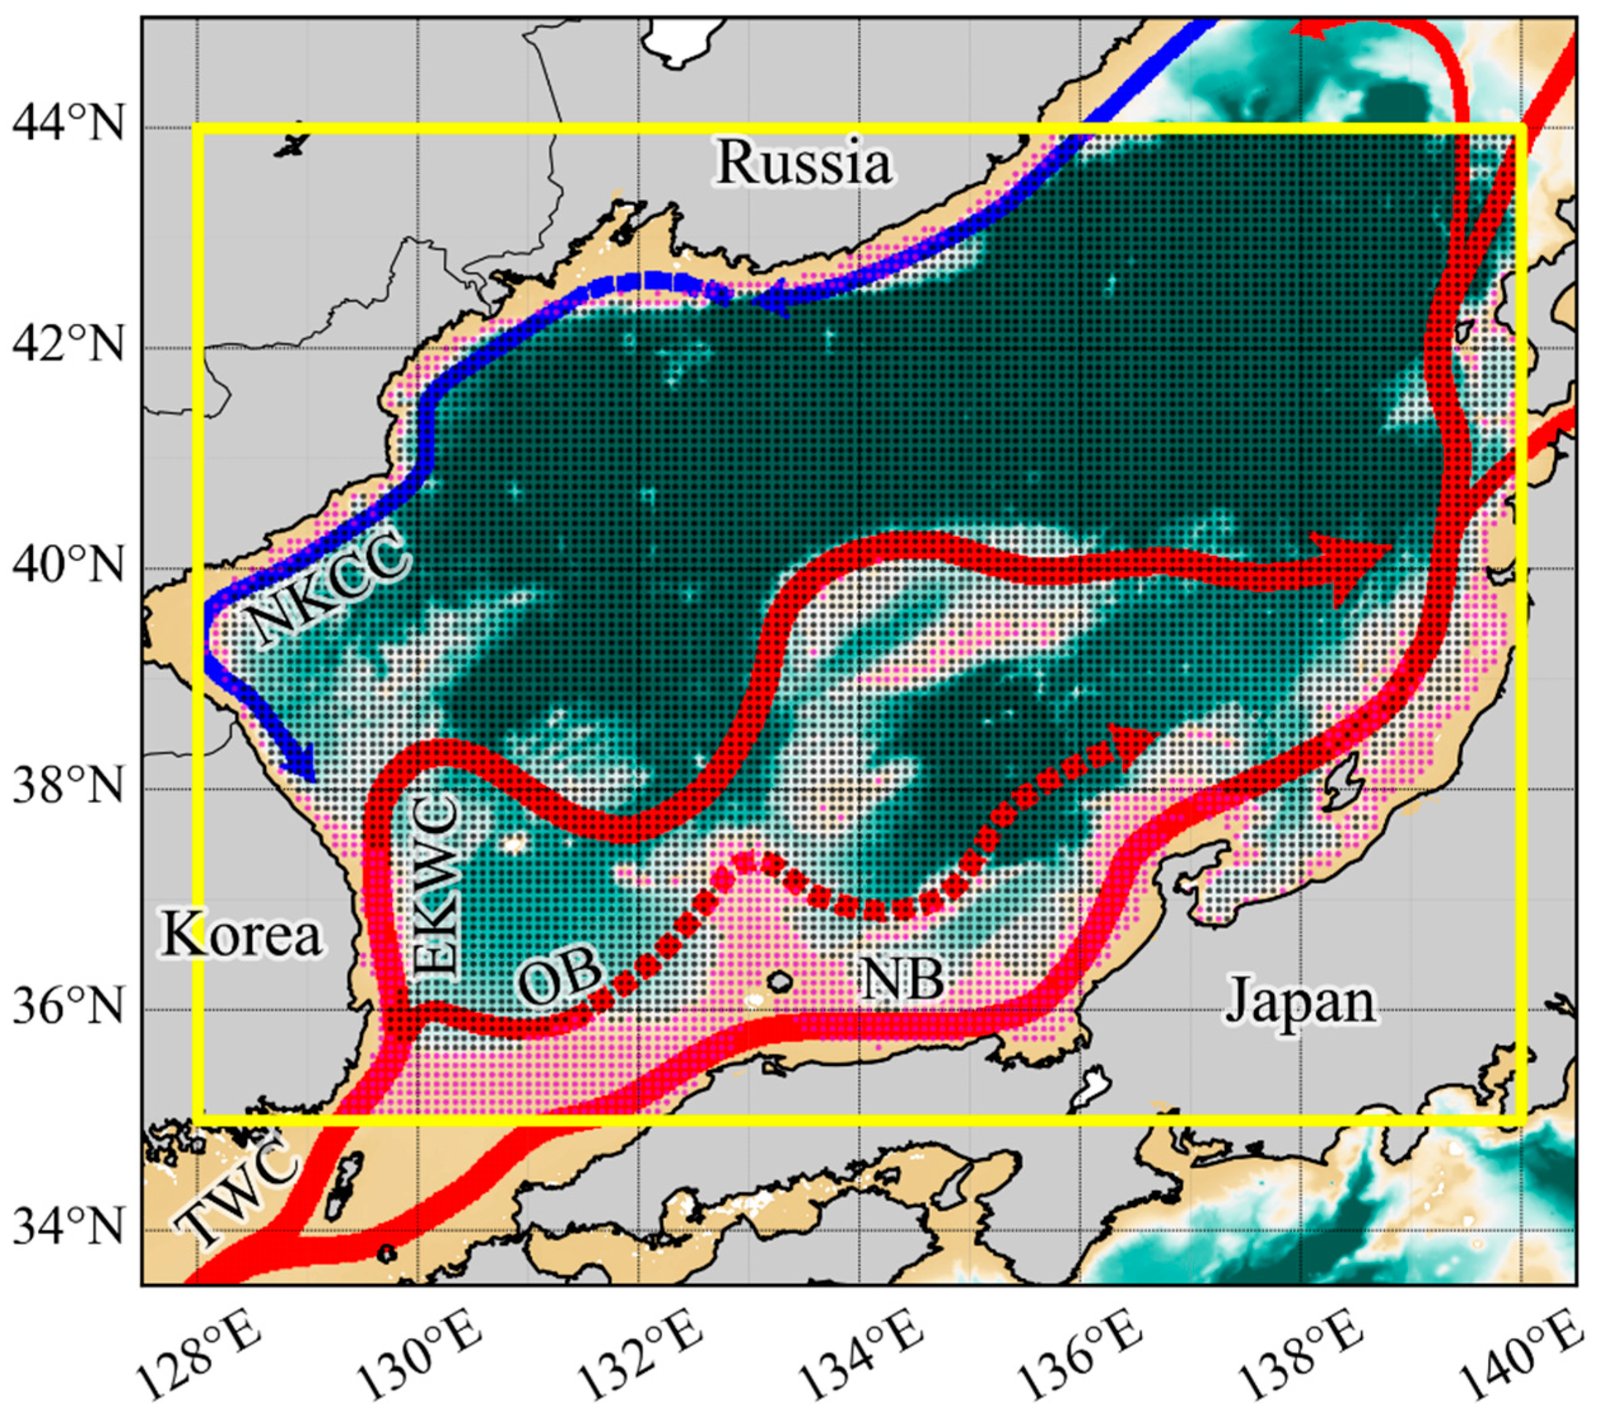
Multidecadal reconstruction and nowcasting of coastal and offshore 3-D temperature fields from satellite observations
Seas around Taiwan
1/4°, 1985–present
105–135°E, 10–35°N. ODB (National Taiwan University)
How the Taiwan dataset is processed
Data collection has increased since 1985, and the downloadable products are statistics over various periods from 1985 to the present. All depth-profile data (temperature, salinity, etc.) are first binned to standard depths by latitude and longitude, then gridded at 15′×15′ (1/4°×1/4°), and the mean and standard deviation of each hydrographic parameter are computed per grid cell. Temperature and salinity are included only where a cell holds at least three records.