How to download GDP data [2026.01.02]
How to obtain hourly (or 6-hourly) interpolated drifter data from the Global Drifter Program through the AOML ERDDAP server, and how to read the result in MATLAB.
1. Find the hourly data page
Start from the GDP homepage: GDP (NOAA AOML). To download the Hourly Interpolated Data, use the toolbar at the top of the page, or go directly to Hourly Interpolated Data.
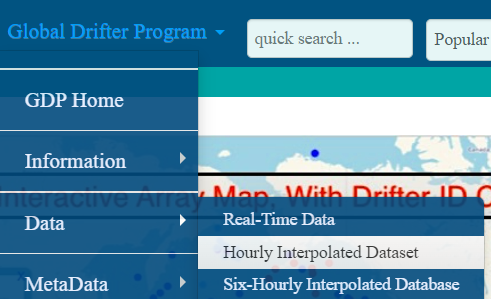
Scroll down until you reach the paragraph below.

- The first link opens the ERDDAP data access form for the hourly interpolated data.
- The second link is a PDF that explains how to use that form.
6-hourly data
For the 6-hour interpolated data use ERDDAP: Global Drifter Program, 6 Hour Interpolated QC Drifter Data.
2. Fill in the ERDDAP form
The PDF above covers everything, but the basic procedure is summarized here.
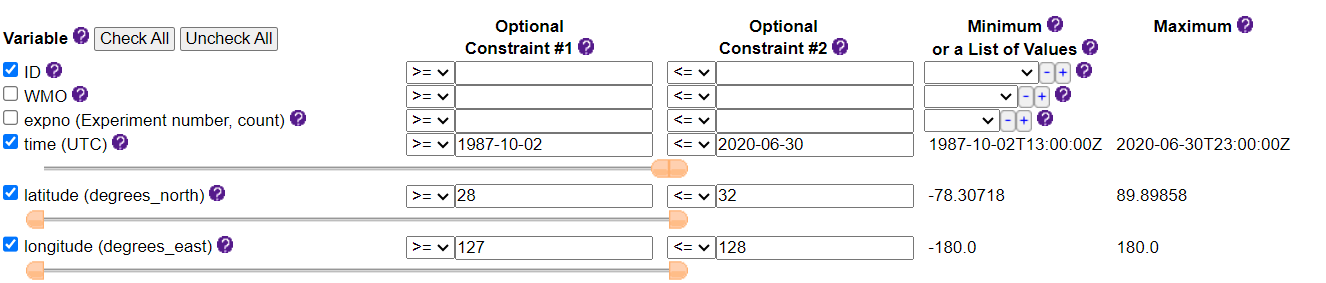
- Click Uncheck All to reset the options.
- Select the basic variables ID, WMO, time, latitude, longitude, sst, ve, vn, drogue_lost_date, drogue_center_depth, plus any others you need.
- In time, enter the period you want, as in the figure above.
- In latitude and longitude, enter the bounds of your study area, as in the figure above.
-
Scroll down to Server-side Functions, which control how the downloaded data are sorted. Tick distinct, select orderBy, and sort by ID, time (or any order you prefer).

Server-side Functions: distinct and orderBy (ID, time) -
Choose the file type. CSV, mat, NC and others are available; pick whichever is easiest for you to handle (I prefer mat or NC). Then click Submit to download.

File type selection; mat is chosen here The URL button builds a direct download link for the same request, which is convenient for sharing an identical dataset with others.
3. Read the mat file in MATLAB
The mat file holds a structure, so use dot notation:
%% Drifter Trajectory

clc; clear; close all;
load drifter_hourly_qc_7b2b_639d_848a.mat ; % change mat filename!!!

d = drifter_hourly_qc; % rename for easier dot notation usage
id = double(unique(string(d.ID))); d.ID = double(string(d.ID));
    % variable id contains all Drifter IDs passing through study area
d.latitude = double(d.latitude); d.longitude = double(d.longitude); % type conversion

% time : seconds since 1970.01.01
d.time = datetime(1970,01,01,00,00,00) + seconds(d.time); % convert to datetime type

figure(1); hold on;
for i = 1:length(id)
    k = d.ID == id(i);
    plot(d.longitude(k), d.latitude(k)) % dot notation
end

clear drifter_hourly_qc;
Dataset citation
Cite the dataset when you use it in a publication
Elipot, Shane; Sykulski, Adam; Lumpkin, Rick; Centurioni, Luca; Pazos, Mayra (2022). Hourly location, current velocity, and temperature collected from Global Drifter Program drifters world-wide. [indicate subset used]. NOAA National Centers for Environmental Information. Dataset. https://doi.org/10.25921/x46c-3620. Accessed [date].
Full dataset from NOAA NCEI
Hourly dataset version 2.00
The hourly dataset version 2.00 is officially available from NOAA NCEI: AOML-GDP-1HR landing page.
On that page, open the "Lineage" tab, follow "Output Datasets", then "data", then "0-data", and finally "gdp_v2.00.nc" to download through your browser. Alternatively, use this direct link to the NetCDF file (about 12 GB).
The dataset is distributed as a single NetCDF file containing contiguous ragged arrays, one for each data variable, together with all metadata. To get started, see the Jupyter Notebook on GitHub with simple usage examples.