Boundary [2026.04.02]
배타적 경제수역(EEZ), 대해양생태계(LME) 등 해양 경계 자료와 해안선, 면적 계산 도구입니다.
경계 자료
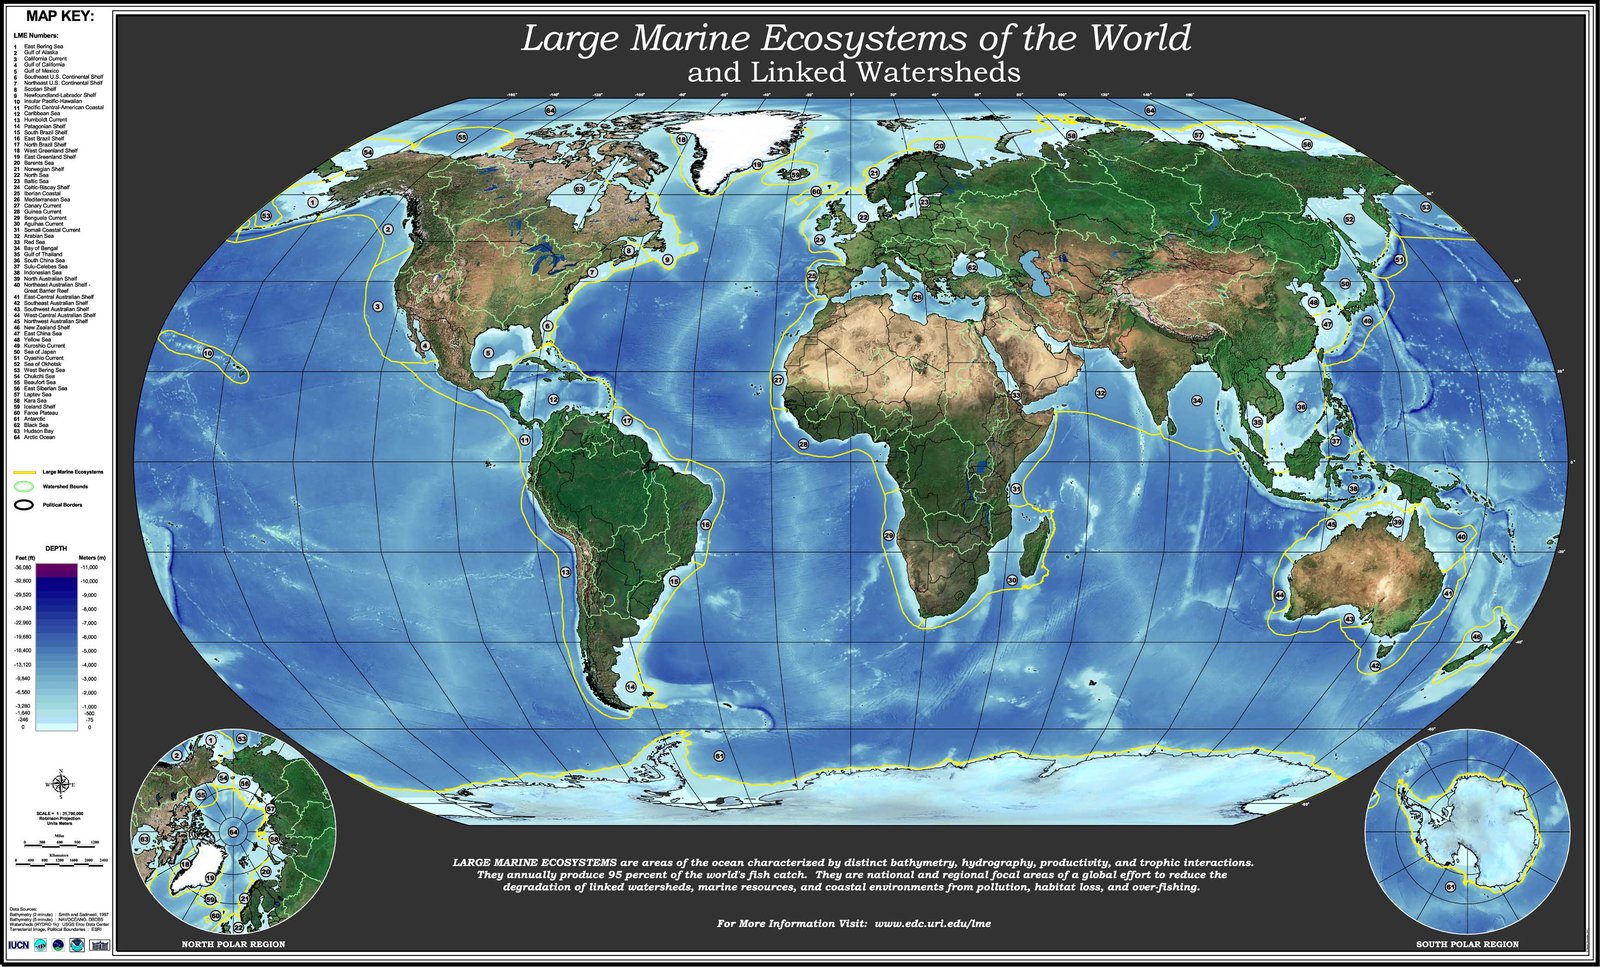
-
Marine Regions
EEZ, LME 등 해양 경계 shapefile
-
Large Marine Ecosystems (LME)
IW:LEARN GeoNode의 LME 레이어와 지도
Global Large Marine Ecosystems
LME-66 Offshore
Large Marine Ecosystems (map) -
Oceans of the World
해양 구분 폴리곤 (IW:LEARN GeoNode)
Oceans of the World
World Oceans and Large Marine Ecosystems (map) -
NOAA LME map
NOAA 200주년 기념 페이지의 LME 지도
해안선·도구
-
Global Coastline
해안선 자료 (GSHHS 등)
Shoreline / Coastline Resources (NOAA NCEI)
GSHHS (NOAA NGDC) -
Area on sphere / ellipsoid
구면·타원체 좌표에서 폴리곤 면적 계산 (MATLAB Mapping Toolbox)
MATLAB에서 EEZ 그리기
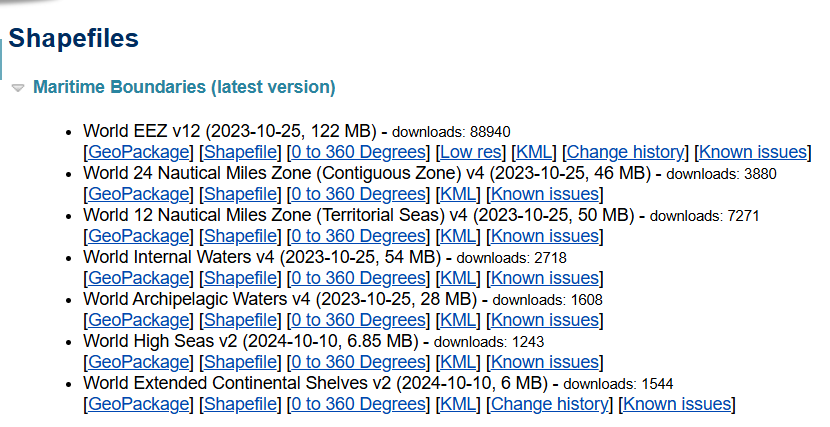
Marine Regions에서 EEZ Low res 파일을 다운받은 후, .dbf, .shp, .shx 파일을 한 폴더에 넣습니다.
shaperead를 쓰려면 Mapping Toolbox 애드온 설치가 필요합니다.
Clip EEZ polygons to a region and draw them with m_map
Clip EEZ shapefile and draw with m_map
S = shaperead('D:\eez_v12_lowres.shp'); % mapping toolbox 에드온 설치 필요

lat_min = mla(1);
lat_max = mla(2);
lon_min = mlo(1);
lon_max = mlo(2);

keep = false(1, numel(S));
for k = 1:numel(S)
    X = S(k).X;
    Y = S(k).Y;
    mask_valid = ~isnan(X) & ~isnan(Y);
    % 지정된 범위에 일부라도 걸치는 폴리곤만 선택
    keep(k) = any(X(mask_valid) >= lon_min & X(mask_valid) <= lon_max & ...
                  Y(mask_valid) >= lat_min & Y(mask_valid) <= lat_max);
end
S_clip = S(keep);


% m map 켠 후

    for k = 1:numel(S_clip)
        xCoord = S_clip(k).X;
        yCoord = S_clip(k).Y;

        % NaN으로 끊어진 세그먼트 경계 찾기 (선 하나하나 그리기 위해)
        nanPos = find(isnan(xCoord) | isnan(yCoord));
        edges  = [0, nanPos, numel(xCoord)+1];

        for s = 1:numel(edges)-1;
            i1 = edges(s)+1;
            i2 = edges(s+1)-1;
            if i2 < i1, continue; end

            xs = xCoord(i1:i2);
            ys = yCoord(i1:i2);


            % 지도 범위 밖 세그먼트 건너뛰기
            if all(xs < lon_min | xs > lon_max | ys < lat_min | ys > lat_max)
                continue
            end

            % reducem은 열벡터 기대 → 열로 변환
            xs = xs(:);
            ys = ys(:);

            mask = true(size(xs));   % 기본: 모두 사용

            % 여기에 필터링을 추가하면 원하는 선만 그릴 수 있음
            d = diff([false; mask; false]);
            iStart = find(d == 1);
            iEnd   = find(d == -1) - 1;

            for jj = 1:numel(iStart)
                segx = xs(iStart(jj):iEnd(jj));
                segy = ys(iStart(jj):iEnd(jj));
                if numel(segx) < 2, continue; end

                % 단순화 후 그리기
                [segyR, segxR] = reducem(segy, segx, 0.05);
                if numel(segxR) < 2, continue; end

                m_line(segxR, segyR, 'color',[0 0.6 0], 'linestyle','--', 'linewidth',1.2);
            end

        end
    end