Sea Surface Salinity [2024.11.26]
SMOS, Aquarius, SMAP 위성의 표층 염분(SSS) 자료와 이를 합성한 다중 위성 자료, 그리고 RSS SMAP 파일을 내려받는 MATLAB 스크립트를 정리했습니다.
PO.DAAC의 SSS 자료 다운로드
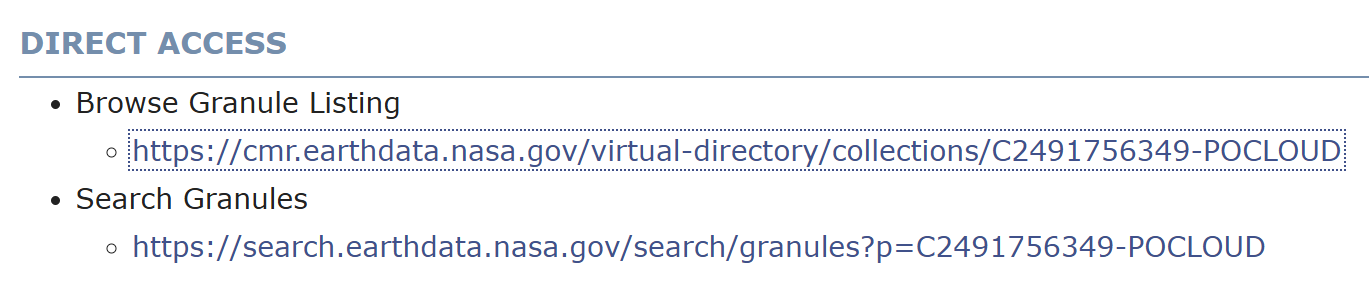
자료를 받을 수 있는 PO.DAAC 링크는 아래 소개하는 product마다 다릅니다. PO.DAAC에서 원하는 자료가 있다면 DIRECT ACCESS > Browse Granule Listing에서 직접 받거나, PO.DAAC MATLAB 다운로드 매뉴얼을 참고하세요.
- Which salinity data are best for you? (NASA Salinity). 또는 아래의 CMEMS 다중 위성 합성 자료를 사용하셔도 됩니다.
위성 SSS 관측
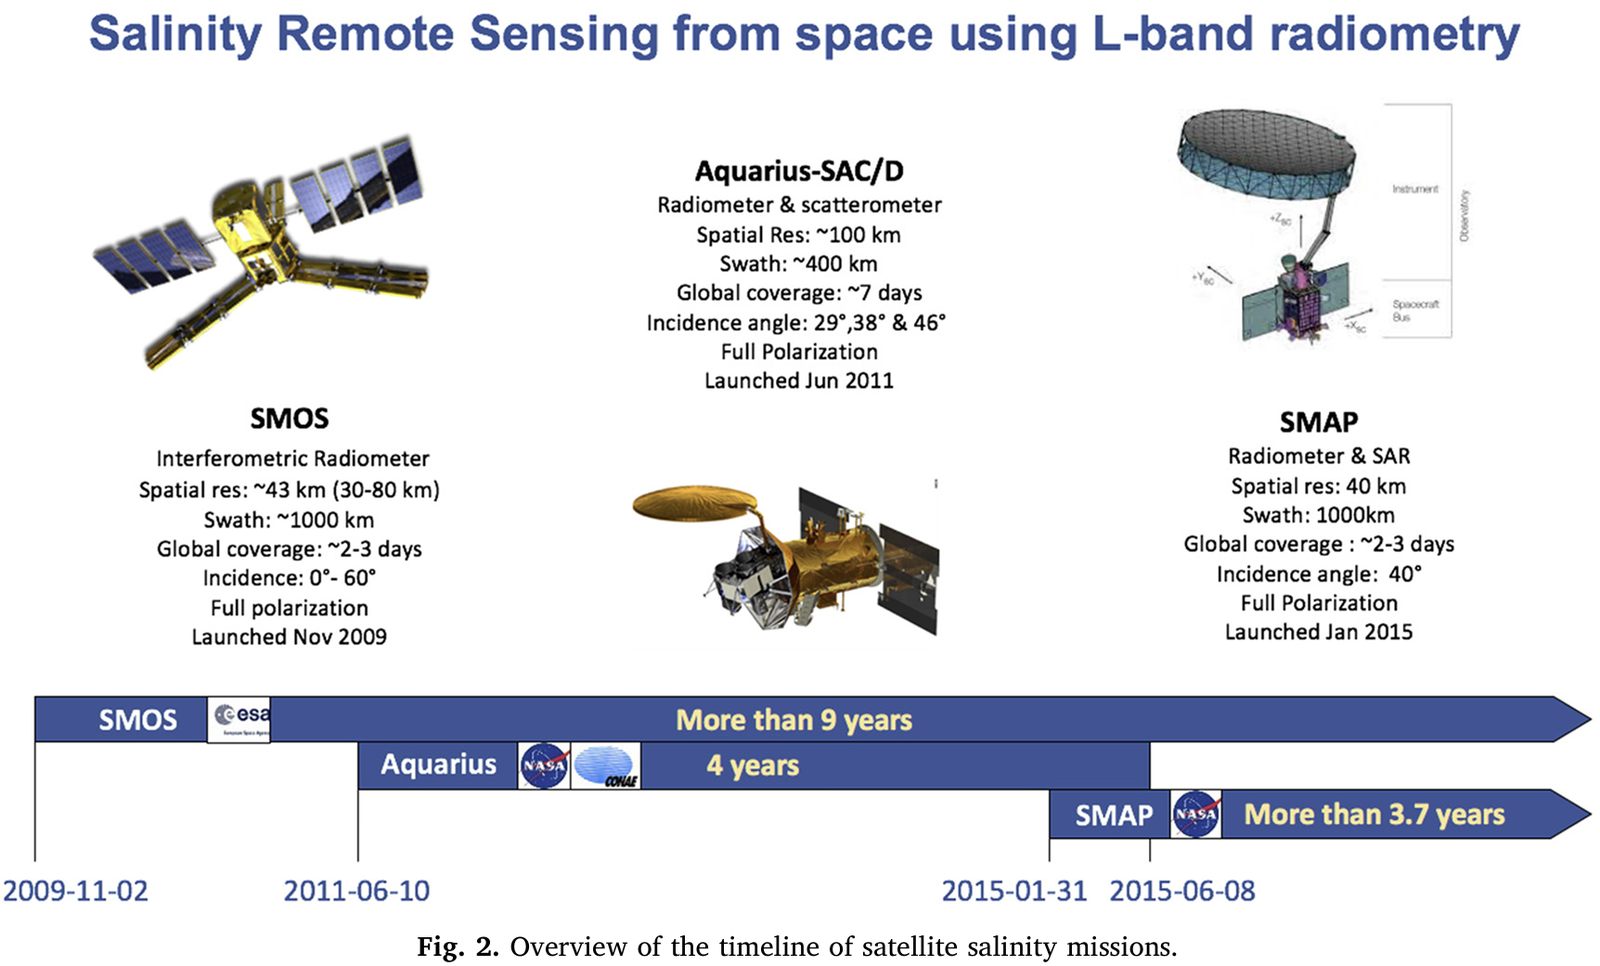
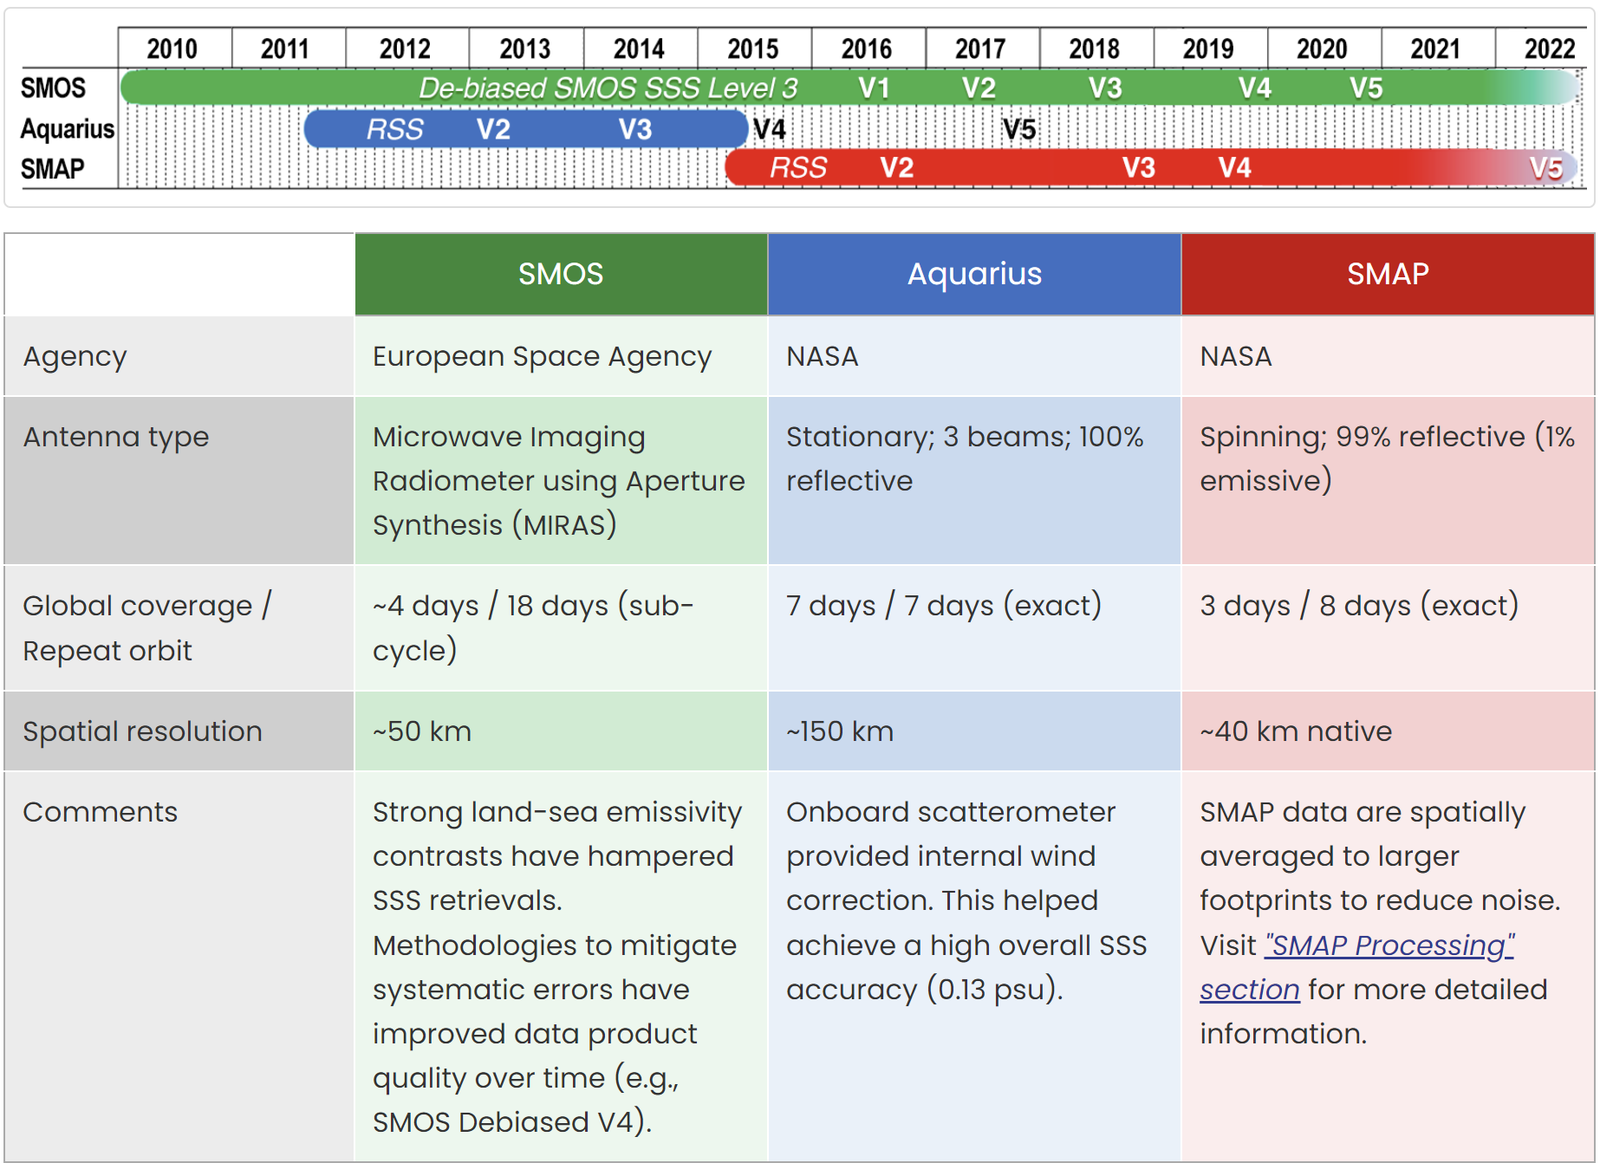
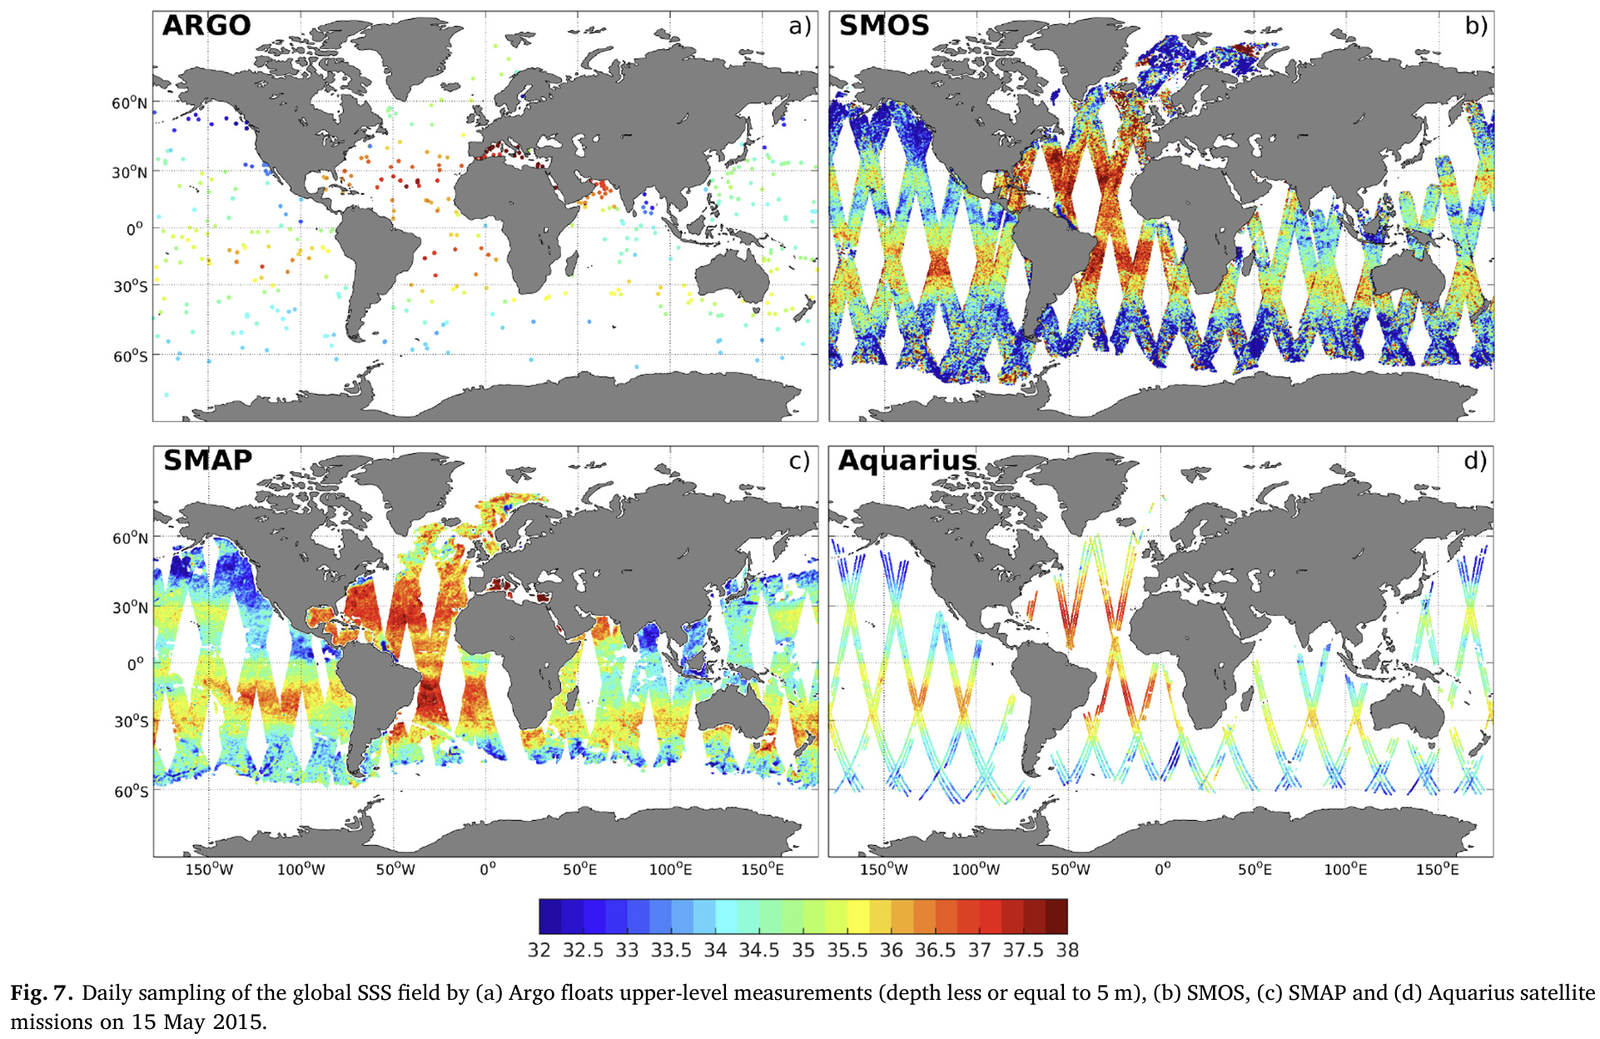
우리나라 주변 해역 커버리지
SMOS는 우리나라 주변 해역을 커버하지 않으므로, 이 해역을 보려면 SMAP을 활용해야 합니다. Aquarius는 현재 운용되지 않으며, 현재 시기에 대해서는 SMAP 자료가 가용합니다.
합성 자료 (SMOS, Aquarius, SMAP)
-
MULTIOBS_GLO_PHY_S_SURFACE_MYNRT_015_013 (CMEMS) · 0.125° · daily, monthly · 1993-01-01 – 2025-01-23
전 지구, 89.94°S–89.94°N, 179.94°W–179.94°E
-
MULTIOBS_GLO_PHY_SSS_L4_MY_015_015 (CMEMS) · 0.25° · weekly · 2010-06-03 – 2025-01-02
전 지구, 83.6°S–83.6°N. SMOS와 SMAP의 객관 분석
Product page
Objective Analysis of SMOS and SMAP SSS (JTECH) -
OISSS_L4_multimission_monthly_v2 (PO.DAAC) · 0.25° · monthly · 2011-08-01 – present
Aquarius/SAC-D, SMAP, SMOS 세 위성을 최적 내삽(7일 decorrelation time scale)으로 합성한 L4 OISSS의 월평균
SMOS
-
ESA SMOS
미션 페이지 및 자료 접근
-
SMOS CATDS Qualified (L2Q) SSS (CMEMS) · 0.25° · daily · 2010-01-12 – 2024-11-24
전 지구, 83.6°S–83.6°N
Aquarius
Aquarius data are available from two locations. The archive of record for Aquarius archived data products is NASA's Physical Oceanography Distributed Active Archive Center (PO.DAAC), located at the Jet Propulsion Laboratory. In addition to the Level-1a orbital source data products which are updated daily, refined Level 2 orbital swath data and Level 3 gridded salinity and wind speed products (1 degree spatial resolution for daily, 7 day, monthly, seasonal, and annual time intervals) are updated monthly.
SMAP
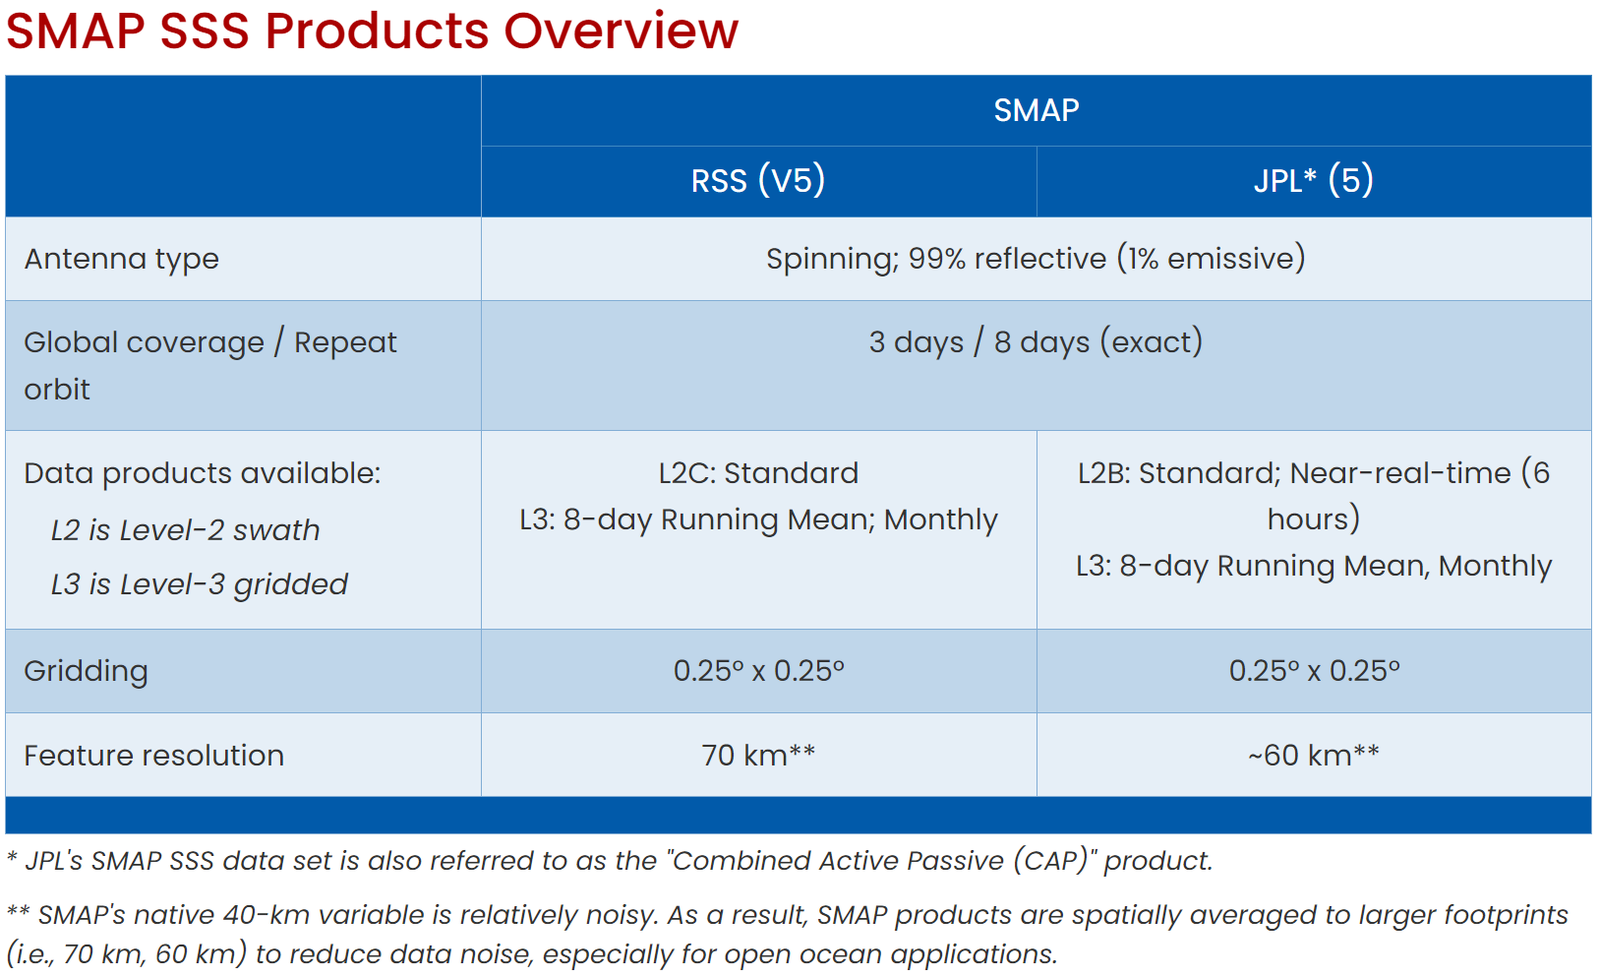
NASA JPL (PO.DAAC) 자료
사이트는 JPL이지만, RSS와 JPL product가 모두 제공됩니다.
JPL CAP 알고리즘
- L2 weekly V5.0
- Gridded (L3) monthly V6.0
- Gridded (L3) 8-day running mean V6.0
SMAP_JPL_L2B_SSS_CAP_V5
SMAP_JPL_L3_SSS_CAP_MONTHLY_V5
SMAP_JPL_L3_SSS_CAP_8DAY-RUNNINGMEAN_V5
Remote Sensing Systems
- L2 hourly V6.0
- Gridded (L3) monthly V6.0
- Gridded (L3) 8-day running mean V6.0
SMAP_RSS_L2_SSS_V6
SMAP_RSS_L3_SSS_SMI_MONTHLY_V6
SMAP_RSS_L3_SSS_SMI_8DAY-RUNNINGMEAN_V6
검색 도구: SMAP 미션 (PO.DAAC) · SMAP 자료 목록 (PO.DAAC)
RSS 자료
RSS 70 km 자료에 대하여
The Physical Oceanography Distributed Active Archive Center announced the availability of updated version 2.0 SMAP Sea Surface Salinity (SSS) data from Remote Sensing Systems (RSS) at a spatial resolution of 70 km.
As is the case for the 40-km resolution product, the 70-km product is resampled onto a 0.25° fixed Earth grid using a Backus-Gilbert type optimum interpolation (OI). In the case of the 70-km product, the target cell of the OI is a circular footprint with a diameter of 70 km. Compared to the 40-km product, the 70-km is spatially smoother and the random noise is reduced by 60%. For most oceanographic applications, it is recommended that the new 70-km product be used.
Data sets comprising this release include the Level 2C orbital data and two Level 3 mapped salinity products: an 8-day running mean product based on the repeat orbit of the SMAP mission, along with a monthly average product. All products are in the netCDF4 file format, and the L3 products are CF/ACDD metadata standards compliant. The formats of the 40 km and 70 km products are the same.
MATLAB으로 RSS SMAP SSS 다운로드 [2024.12.01]
RSS SMAP V6.0 validated L3 파일(8-day running mean은 2015-04-01부터, monthly는 2015-04부터)을 RSS 서버에서 직접 내려받습니다. 기간과 저장 폴더를 설정한 뒤 필요한 섹션을 실행하세요.
MATLAB 스크립트
%% Download RSS SMAP Salinity V6.0 Validated Dataset
%   source : https://www.remss.com/missions/smap/salinity/
%
%   Written by Jiuk Hwang. 2024.12.01

%% Gridded (L3) 8day Running
%   Date Range : 2015.04.01 ~ Present
clc; clear;
dt = datetime(2015,4,1):caldays(1):datetime(2015,4,1);

FigFolderNm = 'D:\MATLAB_JU\2024_RS_Assign6_SMAP';
if ~exist(FigFolderNm, 'dir')
    mkdir(FigFolderNm);
end

for iyear = unique(year(dt))
    dtid = year(dt) == iyear;
    hamster = dt(dtid);
    for iday = 1:length(hamster)
        hamster2 = days(hamster(iday) - datetime(iyear, 1, 1) + 1);
        link = sprintf("https://data.remss.com/smap/SSS/V06.0/FINAL/L3/8day_running/%d/RSS_smap_SSS_L3_8day_running_2015_%03.0f_FNL_v06.0.nc", iyear, hamster2);

        websave(sprintf('%s\\%s.nc', FigFolderNm, string(hamster(iday))), link)
    end
end

%% Gridded (L3) Monthly
%   Date Range : 2015.04 ~ Present
clc; clear;
dt = datetime(2015,4,1):calmonths(1):datetime(2015,4,1);

FigFolderNm = 'D:\MATLAB_JU\2024_RS_Assign6_SMAP';
if ~exist(FigFolderNm, 'dir')
    mkdir(FigFolderNm);
end

for iyear = unique(year(dt))
    dtid = year(dt) == iyear;
    hamster = dt(dtid);
    for iday = 1:length(hamster)
        hamster2 = datetime(hamster(iday), 'Format','uuuu_MM');
        link = sprintf("https://data.remss.com/smap/SSS/V06.0/FINAL/L3/monthly/%d/RSS_smap_SSS_L3_monthly_%s_FNL_v06.0.nc", iyear, string(hamster2));

        websave(sprintf('%s\\%s.nc', FigFolderNm, string(hamster2)), link)
    end
end