Sea Level and Ocean Heat Content [2025.05.02]
해수면과 해양 열용량(OHC)의 지도 및 시계열 product를 모았습니다.
- NASA Sea Level Data Analysis Tool ← 웹에서 바로 시각화
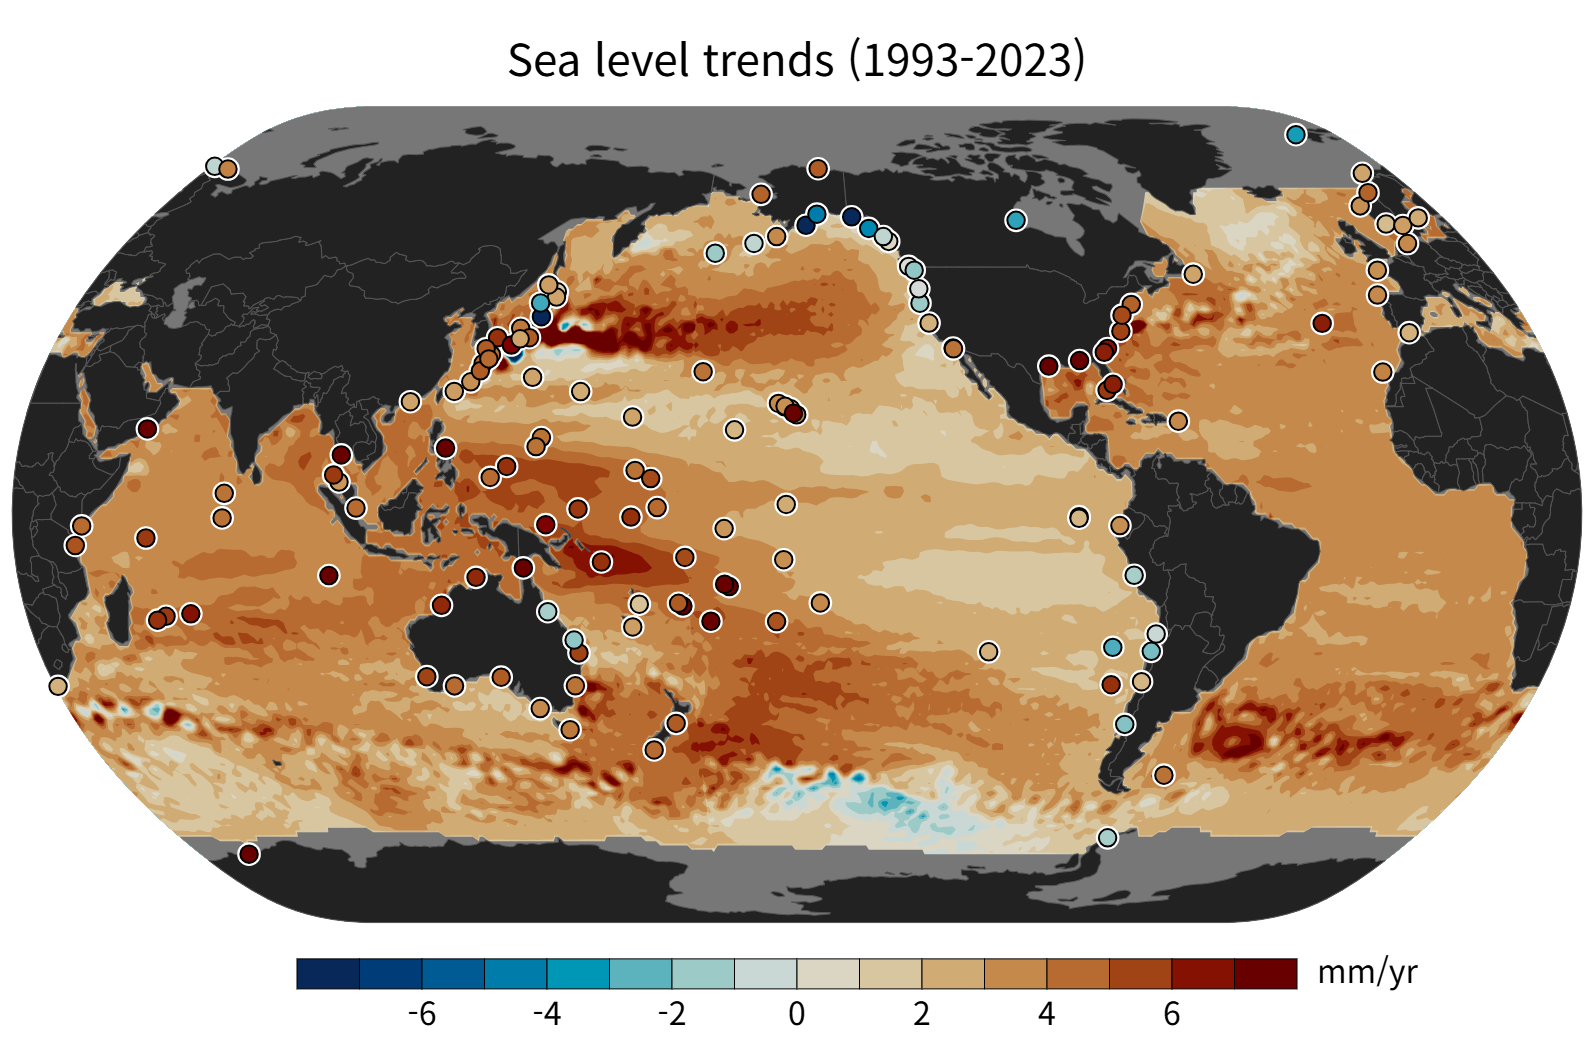
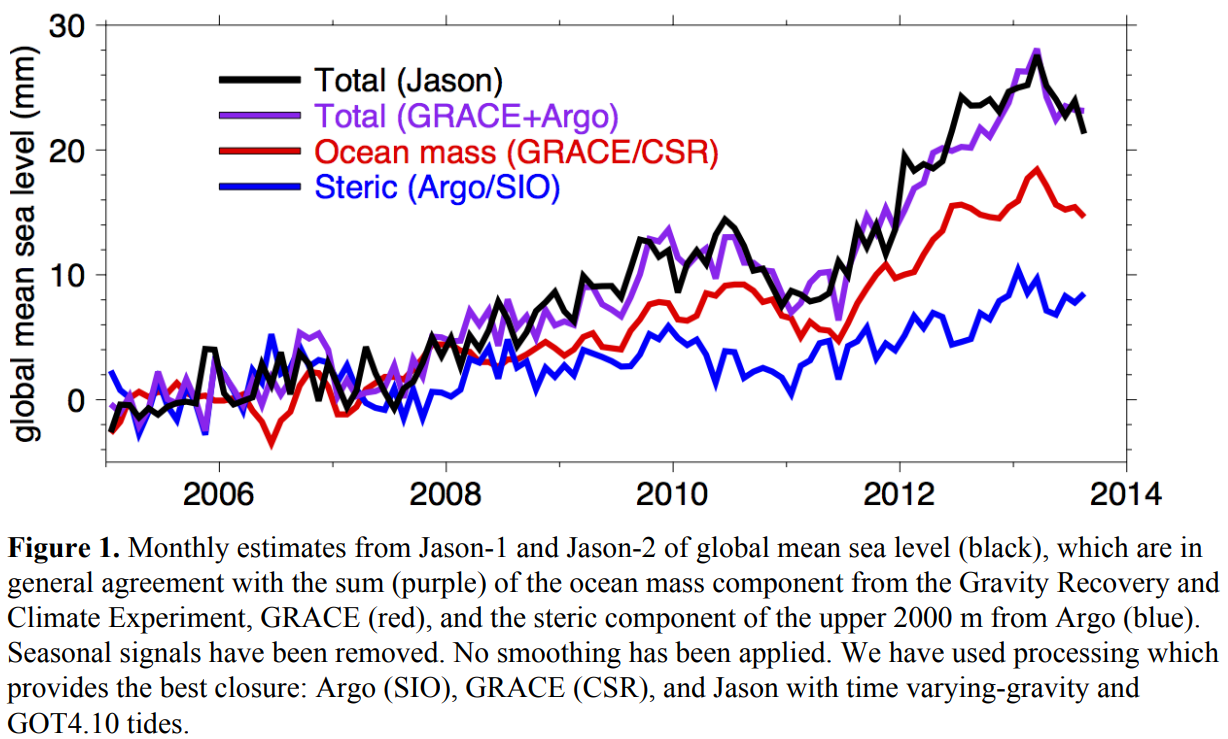
해수면
AVISO Mean Sea Level
Map & Time series
1993년 이후 고도계 기반 전지구 평균 해수면(GMSL) 상승 지표
AVISO Mean Sea Level 설명
Continuous altimetry observations from 1993 to the present have made it possible to establish an important climate indicator: the rise in Global Mean Sea Level (GMSL). Two main factors related to the current global warming explain this GMSL rise: the expansion of the ocean volume and the influx of freshwater from melting ice and glaciers.
AVISO Barystatic & Manometric SL
Time series
위성 측지 기반 barystatic, manometric 해수면 변화
Barystatic vs. manometric sea level
Barystatic sea level changes are due to freshwater exchanges with the continents, including ice mass changes from Greenland, Antarctica and continental glaciers, as well as freshwater fluxes from continental areas (i.e. large river basins such as the Amazon).
Manometric sea level changes are due to several processes, including the atmosphere-ocean circulation, sea level fingerprints and the global water cycle.
The product (NetCDF) is open access via the HTTPS server
or non-authenticated FTP (ftp://ftp.aviso.altimetry.fr/pub/oceano/AVISO/indicators/barystatic_manometric/),
under the AVISO licence agreement.
해양 열용량
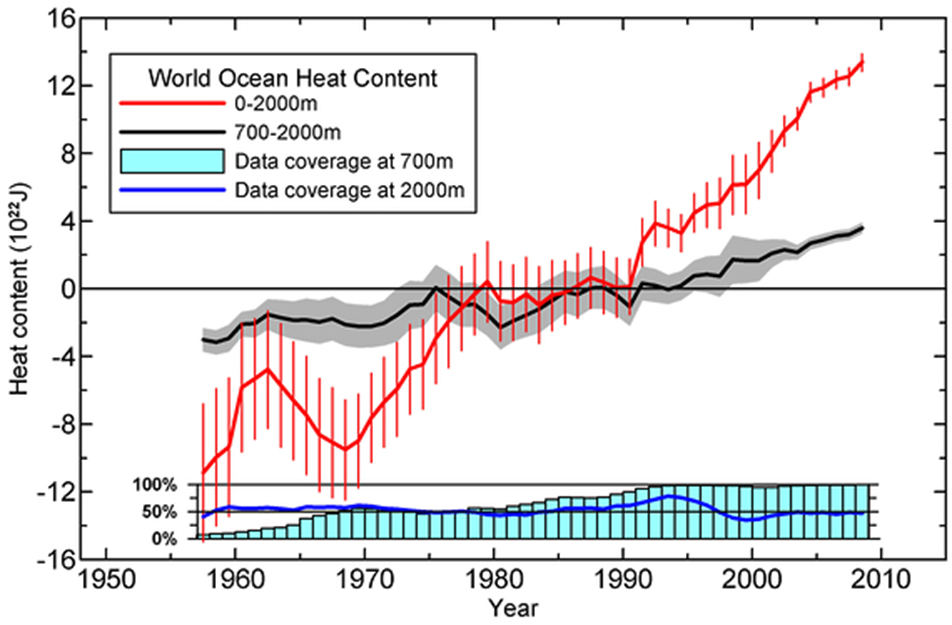
NOAA/NCEI OHC, Salt Content, Sea Level Anomalies
Map & Time series
위성 자료가 아닌, 실측 자료(World Ocean Database) 기반으로 계산되는 것으로 보임. 0–2000 m, 분기별 갱신
Ocean Heat Content, Salt Content, and Sea Level Anomalies
Levitus et al. (2012)
NOAA/NCEI OHC product 상세
These fields and time series are calculated using in situ temperature and salinity data from the World Ocean Database. Calculations are performed as detailed in Levitus et al. (2012) using the World Ocean Atlas 2009 mean climatological fields for 1955–2006 as a basis for anomaly calculations.
Data distribution figures for temperature and salinity observations, temperature and salinity anomaly fields for depths 0–2000 m, heat content and steric sea level (thermosteric, halosteric, total) are updated quarterly. Temperature anomalies and heat content fields are detailed in World Ocean Heat Content and Thermosteric Sea Level change (0–2000 m), 1955–2010 (publication, pdf). Differences between published work and online values are explained in the comments (pdf), and erroneous values in the notes.
The ocean's thermal expansion due to OHC change directly affects sea level. Calculating OHC from in situ subsurface temperature changes allows researchers to create a corresponding time series, but this is limited by the uncertainty of temperature measurements and the geographic and temporal distribution of subsurface observations.
Salinity anomaly fields indicate changes in the ocean's freshwater budget on shorter time scales (evaporation/precipitation, river discharge, etc.) and longer time scales (transfer of freshwater from continental glaciers). They also measure halosteric change, the saline contraction that affects sea level.
NOAA/NCEI Global OHC CDR
1955–present
위 product와 관련된 자료. OPeNDAP 링크 제공. 3개월, 연, 5년 단위 OHCA 시계열
Global OHC CDR 설명
The Ocean Heat Content Climate Data Record (CDR) is a set of ocean heat content anomaly (OHCA) time series for 1955–present on 3-monthly, yearly, and pentadal (five-yearly) scales. It provides time series for multiple depth ranges in the global ocean and each of the major basins (Atlantic, Pacific, and Indian) divided by hemisphere (Northern, Southern).
AVISO OHC change & Earth Energy Imbalance
Time series
고도계 + 중력 관측 기반의 대안적 OHC 변화 추정
AVISO OHC change & EEI 설명
The OHC change can be estimated directly from net ocean surface heat fluxes measured by CERES, from in situ Argo data, or from ocean model reanalyses. AVISO estimates the OHC change with an alternative method based on space altimetry and gravimetry, which complements these approaches and is promising for reducing uncertainty.
The NetCDF product is open access via the HTTPS server
or non-authenticated FTP (ftp://ftp.aviso.altimetry.fr/pub/oceano/AVISO/indicators/OHC_EEI/global_OHC_EEI/),
under the AVISO licence agreement.
See also Ocean Heat Content and Earth Energy Imbalance.
IAPv4
Ocean temperature & OHC gridded
Cheng et al. (2024)
ESSD paper
Temperature (doi:10.12157/IOCAS.20240117.002)
OHC (doi:10.12157/IOCAS.20240117.001)
IAP Ocean